Every Vehicle. Every Asset.Total Visibility.
You cannot manage what you cannot see. T-ERP gives you a live, unified view of your entire fleet - from the boardroom to the workshop floor. No more calling drivers to ask where they are. No more surprise breakdowns. No more guessing what each vehicle costs you.
Key Numbers
The Problem
What we see in the field
You have no idea where your vehicles are right now
Calling drivers, checking WhatsApp, waiting for updates - your fleet is moving but you are flying blind.
Breakdowns are always a surprise
No service schedule, no early warning system. Vehicles fail on the road, trips get cancelled, customers get angry.
You cannot tell which vehicles make money
Revenue goes into one bucket, costs go into another. You have no idea which assets are profitable and which are draining cash.
T-ERP solves all of this.
How It Works
Fleet Management in T-ERP
A detailed look at every capability in this department and how the system handles it.
Live Fleet Tracking
Real-time GPS positions of every vehicle on an interactive map.
Every vehicle in your fleet appears on a live map with real-time GPS coordinates updated every 30 seconds. Zoom in on any asset to see its current speed, heading, driver name, and active trip.
The fleet map is accessible from the ERP dashboard and the Manager mobile app. Supervisors can monitor the entire operation from anywhere - no desk required.
Geofence alerts notify you the moment a vehicle enters or exits a defined zone. Yard departures, customer site arrivals, and unauthorised movements are all captured automatically.
Live Fleet Status
Advanced Asset Profiles
Full lifecycle data per vehicle from purchase to disposal.
Every vehicle has a complete digital profile: registration, VIN, engine number, purchase date, cost, current book value, and depreciation schedule. All in one place, always up to date.
Asset profiles link directly to maintenance history, tyre records, compliance documents, and trip history. One click from the asset record takes you to every work order ever raised on that vehicle.
Credential tracking is built in - licence disc, roadworthy certificate, cross-border permits, and any custom documents you define. Expiry alerts fire automatically so nothing lapses.
Asset Profile Fields
- Registration & VIN
- Purchase cost & depreciation
- Compliance documents
- Tyre positions
- Maintenance history
- Trip & revenue history
Telematics Integration
Automatic data feeds from your existing telematics hardware.
T-ERP connects to your existing telematics provider via our middleware server. Speed, idling time, harsh braking, harsh acceleration, and fuel consumption data flows into the ERP automatically - no manual entry.
Telematics events are linked to the relevant trip and driver record. A harsh braking event on a specific trip is visible on the trip record, the driver scorecard, and the compliance dashboard simultaneously.
We support all major South African telematics providers. If your provider has an API, we can integrate it. Your hardware investment is protected.
Data Flow
Tyre Management
Track every tyre from purchase to disposal by position.
Every tyre in your fleet has a serial number, purchase date, brand, size, and cost recorded in T-ERP. When a tyre is fitted to a vehicle, it is assigned to a specific axle position - steer, drive, or trailer.
Tyre rotations, removals, and retreads are all logged as transactions. The system calculates cost per kilometre per tyre automatically, giving you the data to make informed purchasing decisions.
Disposal records capture the reason for removal - worn, damaged, or failed - and link to the relevant work order. Warranty claims are tracked against the supplier. You stop paying for tyres that should be covered.
Tyre Position Tracking
- Position 1 (Steer L)
- Position 2 (Steer R)
- Position 3 (Drive L outer)
- Position 4 (Drive L inner)
- Position 5 (Drive R inner)
- Position 6 (Drive R outer)
Fleet P&L Dashboard
Per-vehicle profitability: revenue vs. all costs.
The Fleet P&L dashboard shows revenue, fuel, tolls, maintenance, tyre costs, and fixed overheads per vehicle for any date range. You can see at a glance which assets are profitable and which are money pits.
Revenue is pulled automatically from completed trips. Costs are pulled from fuel transactions, work orders, tyre records, and toll captures. No manual data entry. No spreadsheets.
Drill down from any P&L line to the source transactions. If maintenance costs spiked in March, you can see exactly which work orders drove that number in two clicks.
Fleet P&L Summary
Performance Analytics
Route analysis, driver scoring, trend forecasting.
Fleet performance reports cover utilisation rates, average load factors, route efficiency, and cost per kilometre trends over time. Identify underperforming routes and assets before they become problems.
Driver performance scores are calculated automatically from telematics data: speeding events, harsh braking, idling time, and fuel efficiency. Monthly scorecards are generated without any manual work.
Trend forecasting uses historical data to project future maintenance costs, tyre replacement cycles, and fuel spend. Plan your budget with data, not guesswork.
Analytics Reports
- Fleet utilisation report
- Cost per kilometre trend
- Driver performance scorecard
- Route efficiency analysis
- Fuel consumption report
- Maintenance cost forecast
End-to-End Workflow
How Fleet flows through T-ERP
Asset Registered
Vehicle added to T-ERP with full profile, documents, and opening meter reading.
Telematics Connected
GPS and telematics data begins flowing automatically into the fleet module.
Trips Assigned
Vehicle is assigned to freight orders. Revenue is tracked per trip per asset.
Costs Captured
Fuel, tolls, maintenance, and tyre costs are allocated to the vehicle automatically.
P&L Calculated
Real-time profitability per vehicle. Know your numbers without a spreadsheet.
Asset Registered
Vehicle added to T-ERP with full profile, documents, and opening meter reading.
Telematics Connected
GPS and telematics data begins flowing automatically into the fleet module.
Trips Assigned
Vehicle is assigned to freight orders. Revenue is tracked per trip per asset.
Costs Captured
Fuel, tolls, maintenance, and tyre costs are allocated to the vehicle automatically.
P&L Calculated
Real-time profitability per vehicle. Know your numbers without a spreadsheet.
Platform Integration
How Fleet connects to the rest of T-ERP
Every department in T-ERP shares a single database. Data flows automatically - no manual transfers, no reconciliation.
Asset records and meter readings drive preventive maintenance schedules
Vehicles are assigned to trips; trip revenue feeds fleet P&L
Vehicle documents, inspections, and telematics data feed compliance reports
Fleet costs and depreciation post automatically to the general ledger
Operational Guides
Fleet Management Guides
3 in-depth guides for operators
What Is Fleet Management? A Complete Guide for SA Operators
Fleet management covers every process involved in running a commercial vehicle operation - from asset tracking and maintenance to compliance and cost control. This guide explains what it means for South African operators.
- What Is Fleet Management?
- Key Components of a Fleet Management System
- Why Fleet Management Matters in South Africa
- +3 more sections
Tyre Management: Tracking Cost Per Kilometre for SA Fleets
Tyres are one of the largest variable costs in any fleet. This guide explains how to track tyre performance, manage rotations, and calculate true cost per kilometre.
- Why Tyre Management Matters
- Tracking Tyres by Position
- Tyre Rotation and Service Intervals
- +3 more sections
Vehicle Lifecycle Management: From Purchase to Disposal
Every vehicle has a lifecycle - from acquisition through operation to disposal. Managing this lifecycle effectively reduces costs and maximises asset value.
- The Vehicle Lifecycle Explained
- Acquisition and Capitalisation
- Operational Phase: Tracking and Compliance
- +3 more sections
Latest Insights
Fleet Management Insights
News, analysis, and commentary
ADT Fleet Management SA Mines: Complete Operator Guide 2026
Complete guide to ADT fleet management for SA mines. Covers inspections, haul cycles, tyre costs, fuel benchmarks, and MHSA compliance for Bell, Cat, and Volvo ADTs.
Fifth Wheel Trailer Maintenance SA: Complete Guide 2026
Fifth wheel trailer maintenance for SA operators. Inspection schedules, lubrication, brake checks, and failure prevention for heavy vehicle fleets.
Tyre Pressure Monitoring System Fleet SA: Complete Guide 2026
TPMS for SA fleets: prevent R47,000 blowouts with R200/month sensors. Complete guide to hardware, integration, and ROI for heavy vehicle operators.
Plant Hire Utilisation SA: From 58% to 80% Guide 2026
SA plant hire operators average 58% utilisation while top performers hit 80%. Learn the practical steps to close that gap and boost fleet profitability.
Fleet Cost Per Kilometre South Africa: Complete Guide 2026
SA fleet operators miss R350,000+ per truck yearly in untracked costs. Calculate your true fleet cost per kilometre with 2026 benchmarks and tracking methods.
ADT Tyre Costs SA: Drop from R127/km to R89/km Guide 2026
SA mining operators cut ADT tyre costs from R127/km to R89/km with proper tyre management. Real benchmarks, TPMS ROI, and lifecycle tracking explained.
Fuel Management Fleet South Africa: Complete Guide 2026
SA fleet fuel management guide covering driver behaviour, fuel theft prevention, and practical steps to cut diesel costs by 15% or more in 2026.
Plant Hire Management South Africa: Data-Driven Guide 2026
SA plant hire operators lose billions to theft and poor management. Learn how connected equipment and integrated ERP systems improve utilisation and protect margins.
Vehicle Tracking Telematics SA: Fleet Contract Guide 2026
What SA fleet operators should ask before signing any tracking contract. Compare telematics providers, integration requirements, and evaluation criteria for 2026.
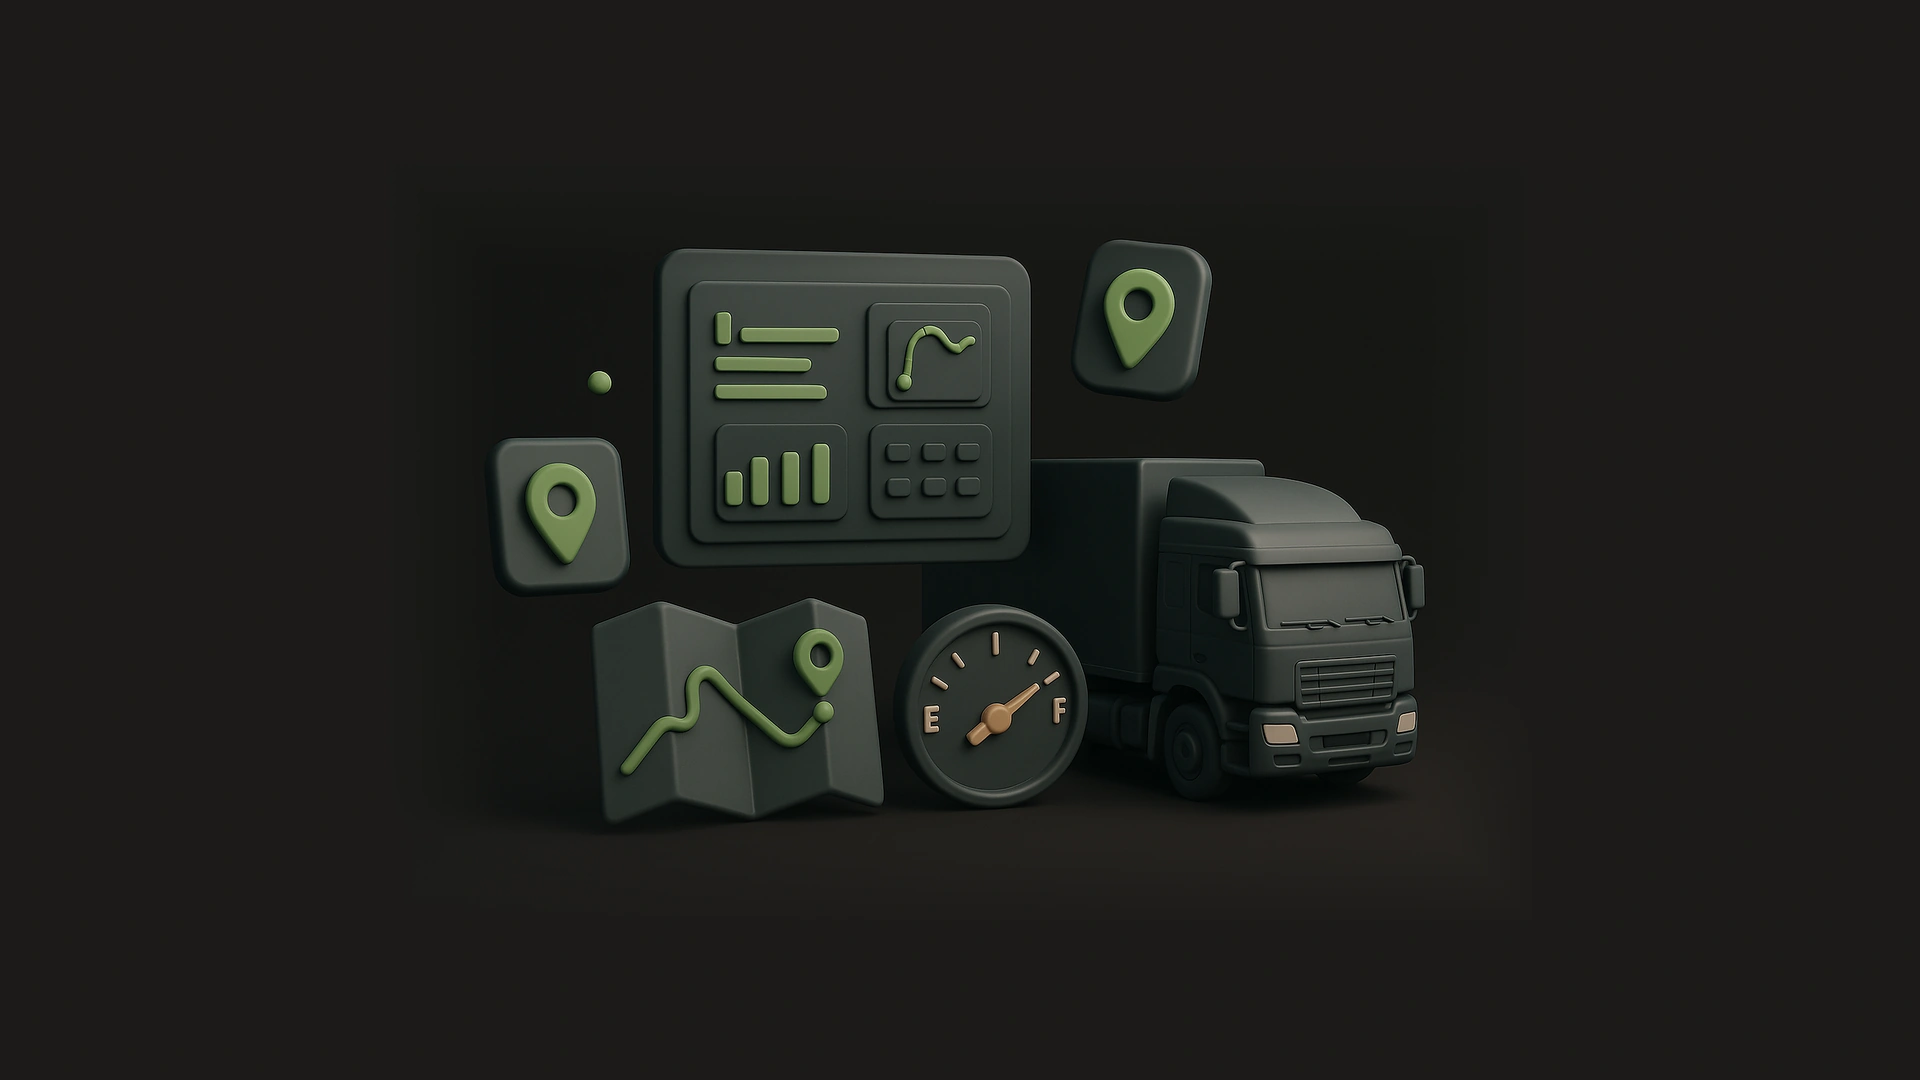
Fleet Management South Africa: How to Cut Costs in 2026
Fleet management software helps SA operators cut fuel costs by 8-15% and streamline compliance. Practical guide for transport, logistics and mining fleets.
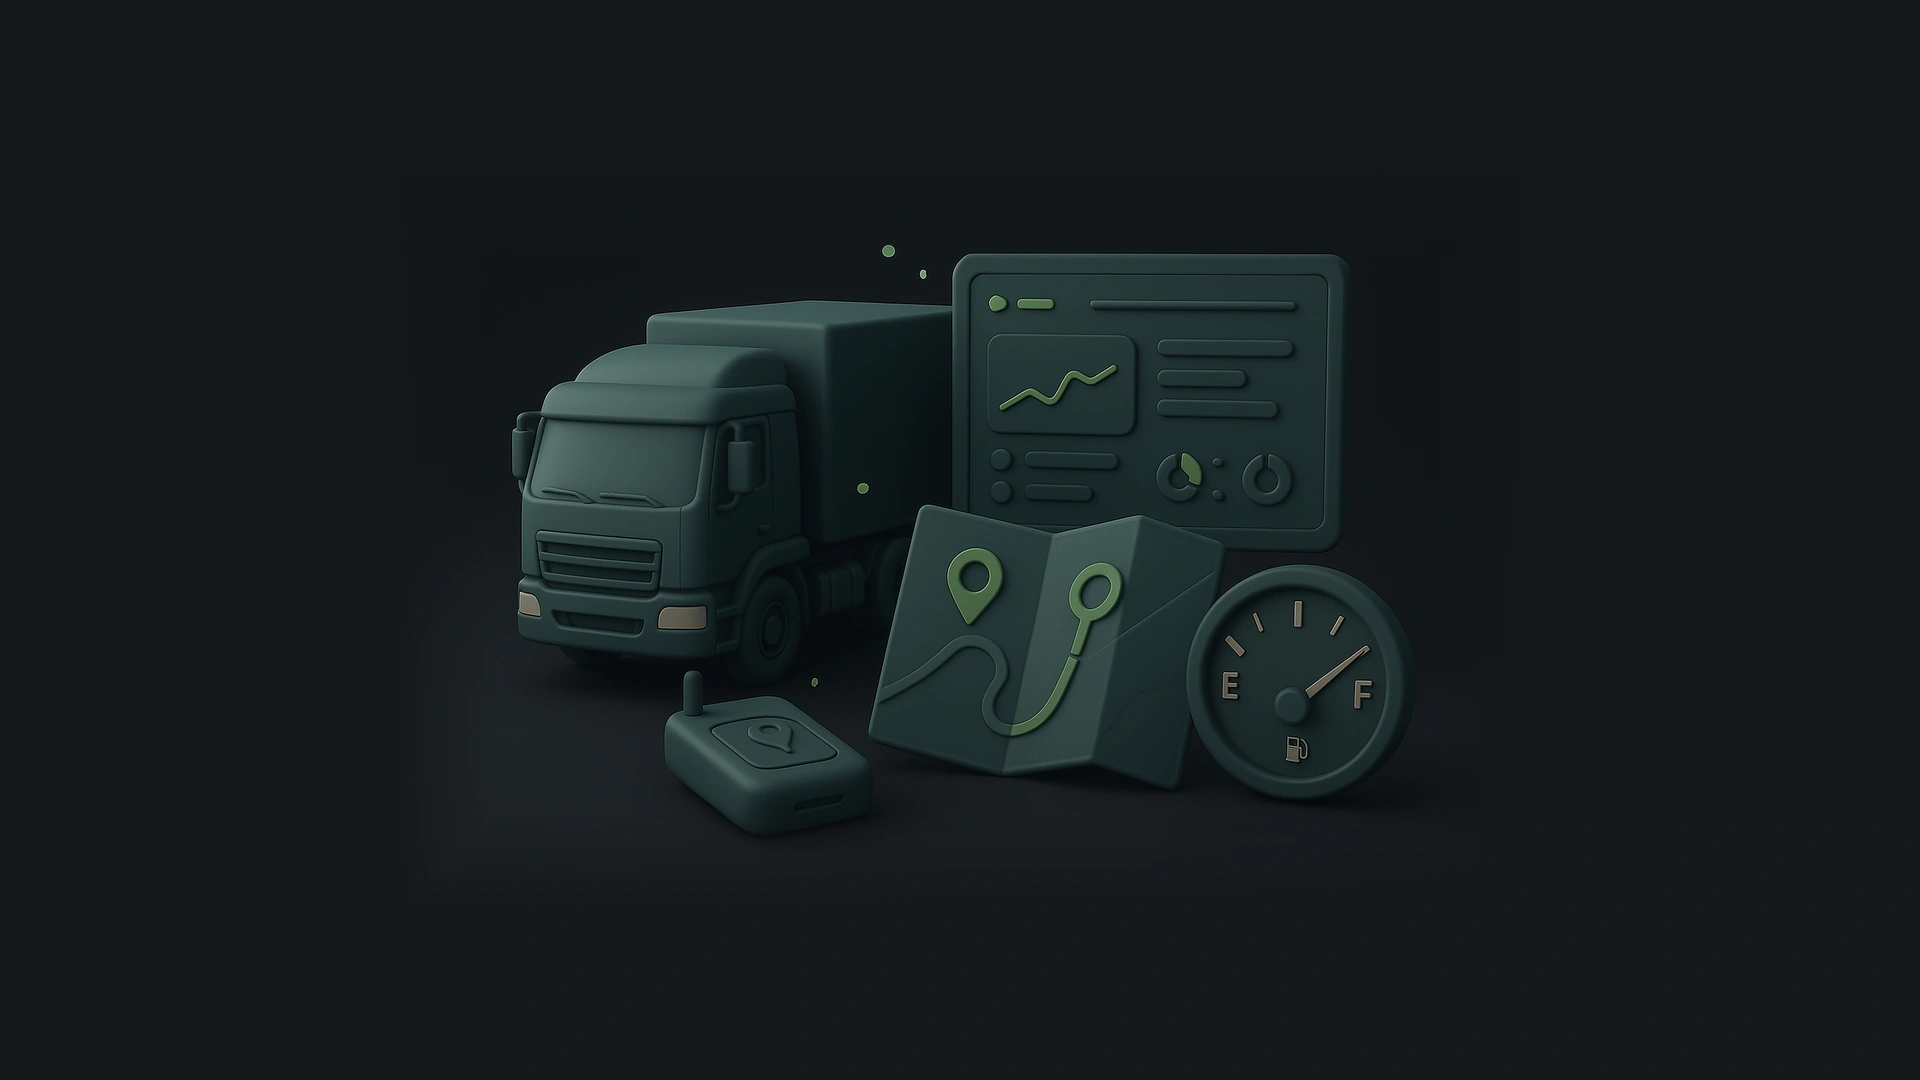
Fuel Price Increase: How SA Fleet Operators Can Protect Margins
With diesel prices predicted to reach R40 per litre by May 2026, fuel management for fleets in South Africa has never been more critical. Without proper fuel monitoring and cost management systems, many SA transport operators will struggle to protect their margins.

Fleet Management Software in South Africa: A Practical Buyer's Guide
With dozens of fleet management tools on the market, choosing the right one is difficult. This guide explains what to look for, what questions to ask, and what separates a basic tracker from a true fleet management platform.
One Platform
Explore the full T-ERP platform
Ready to transform your fleet operations?
See exactly how T-ERP handles fleet management for your specific operation. Book a free demo and we will walk you through it.